

Long Beach gets about 315 evenings a year that are good for sitting around a fire. Honolulu gets 14. The typical big US city lands at about 111, a little under one night in three.
To find those numbers, we checked every evening from 2021 through 2025 in the 100 largest US cities. A night counted if it was cool but not cold, dry and calm between 7 pm and 10 pm. We then added three years of EPA air-quality data and each city’s fire pit rules, which we researched city by city.
California takes the whole top 10. San Jose and Oakland top the overall score, which also weighs air quality and local rules, while Long Beach has the most nights. Outside California, Seattle, Portland and the Carolinas are the best bets. At the other end, seven of the 10 worst cities are in Texas, joined by Miami, Honolulu and Chicago, where evenings are too hot, too windy or both.
How we defined a fire pit night
An evening counts when, between 7 pm and 10 pm local time:
- the average temperature is 45°F to 70°F,
- there is no measurable rain (less than 0.01 inch), and
- the average wind is 10 mph or less.
The weather comes from the Open-Meteo historical weather API, which blends observations with weather models to give hourly data for any location. We averaged the five years to get nights per year.
Key findings
- About 111 nights a year is typical. 63 of the 100 cities get at least 100.
- California sweeps the top 10. Long Beach, Irvine, Chula Vista and San Diego each top 300 nights a year.
- Heat costs more nights than cold. Heat was the biggest limit in 61 cities. Miami and Port St. Lucie each have about 209 evenings a year that are too warm.
- October is the best month nationally, with about 16 nights per city. July is the worst, with fewer than 4.
- Wind is the hidden problem. Corpus Christi averages 205 windy evenings a year and Chicago about 120.
- Gas adds the crisp nights. Reno, Seattle and Portland each get 60 to 70 extra dry, calm evenings between 35°F and 45°F. That is chilly for building and tending a wood fire, but easy with a gas fire pit you can turn on in seconds.
- Air quality hurts Southern California. The Los Angeles and Riverside metro areas averaged 107 and 147 unhealthy-air days a year (AQI over 100) from 2023 to 2025 (EPA AirData annual AQI files).
Map: fire pit nights across the US
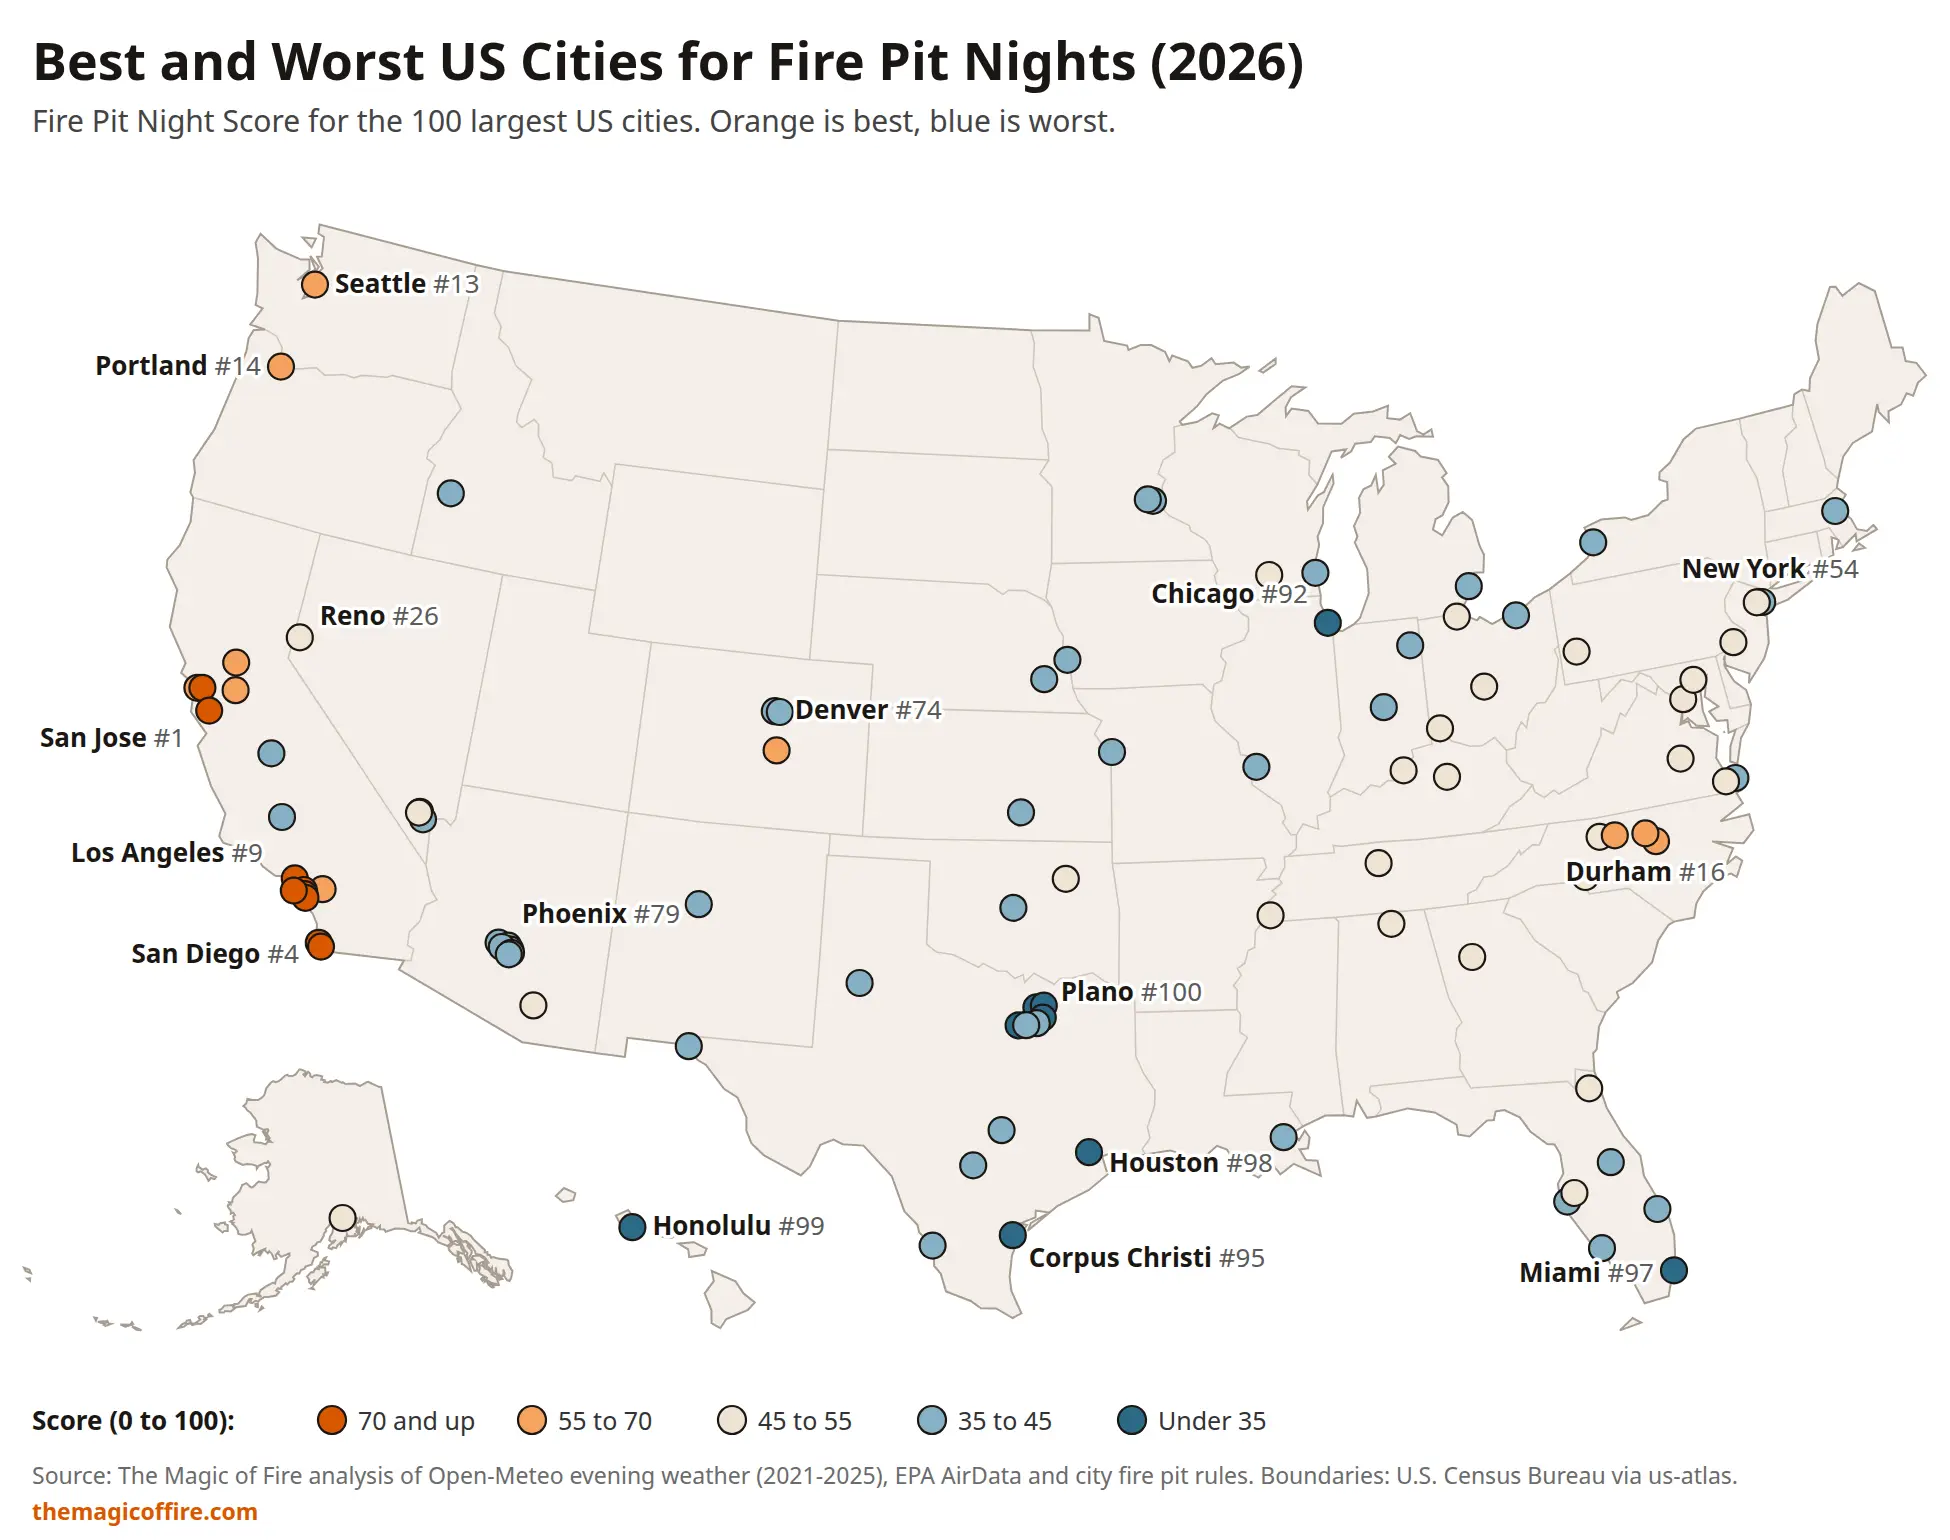
The pattern is clear on the map. The West Coast is orange from San Diego to Seattle, the Carolinas form a smaller warm patch in the East, and the blue cities cluster in Texas, Arizona, South Florida and around the Great Lakes.
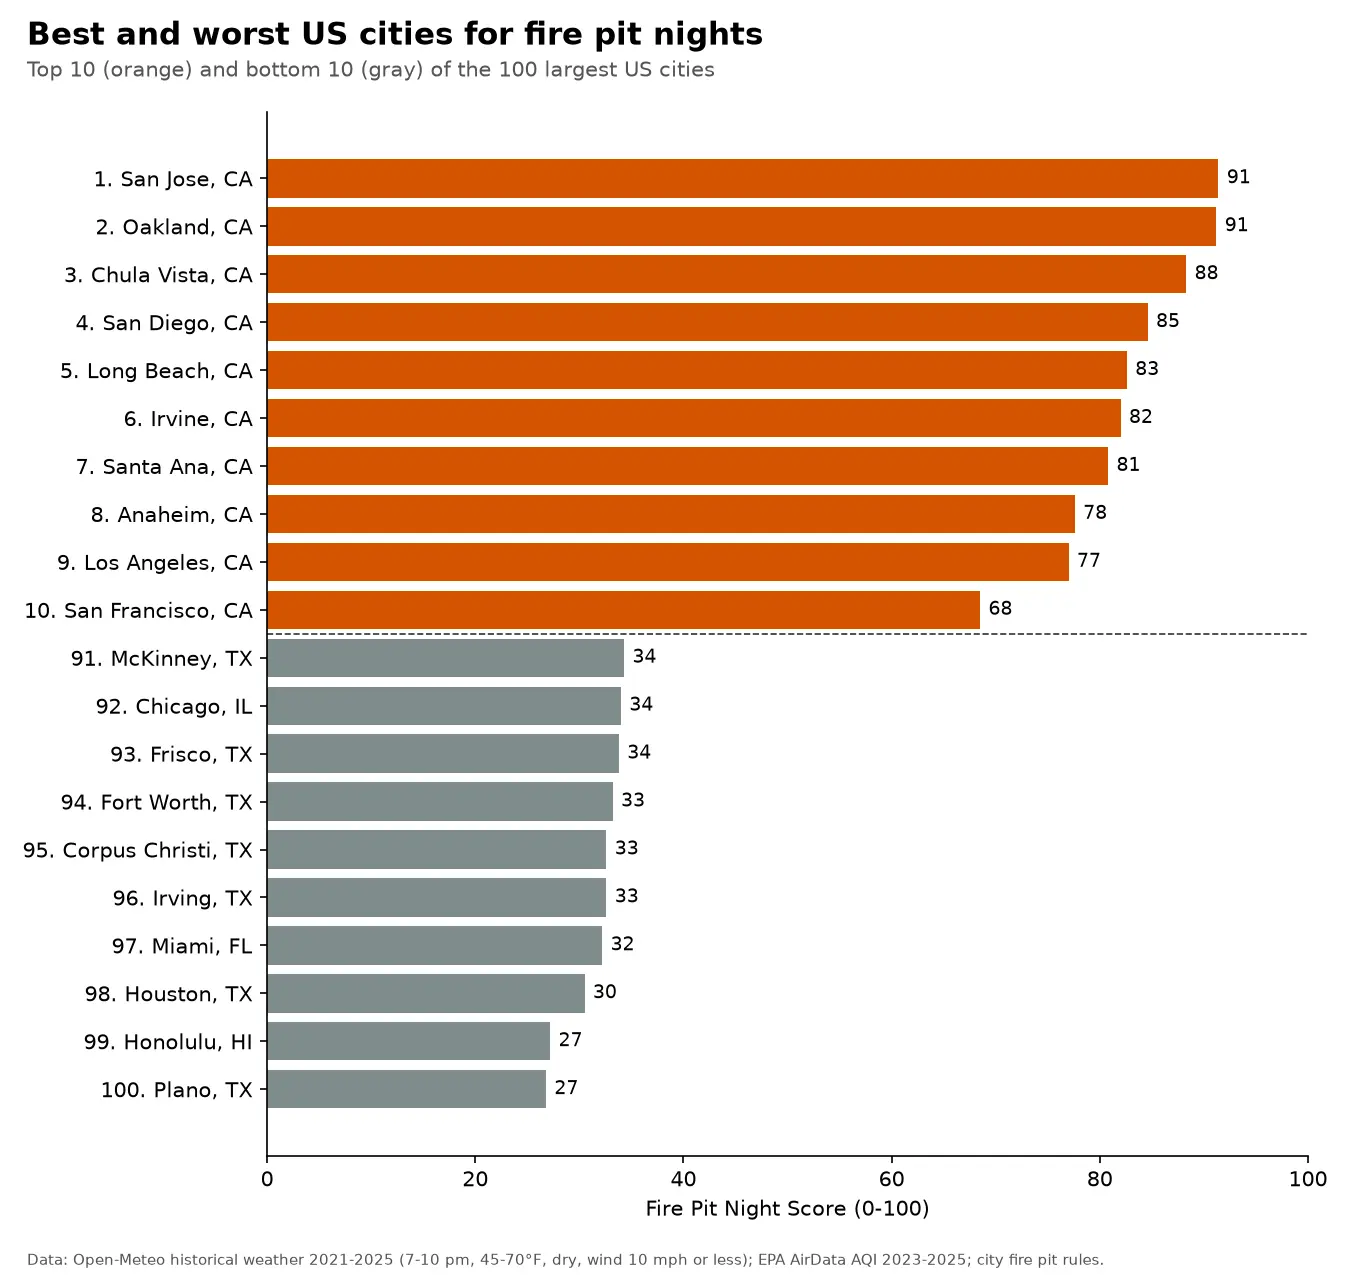
The 10 best cities for fire pit nights
Scroll the table sideways to see every column.
| Rank | City | Score | Nights/yr | Best months | Gas rule |
|---|---|---|---|---|---|
| 1 | San Jose, CA | 91.4 | 291 | Apr, May, Nov | Allowed with rules |
| 2 | Oakland, CA | 91.2 | 283 | Apr, Sep, Oct | Allowed with rules |
| 3 | Chula Vista, CA | 88.3 | 311 | May, Jun, Dec | Allowed with rules |
| 4 | San Diego, CA | 84.6 | 311 | May, Jun, Oct | Permit may apply |
| 5 | Long Beach, CA | 82.6 | 315 | May, Jun, Oct | Allowed with rules |
| 6 | Irvine, CA | 82.0 | 313 | May, Jun, Oct | Allowed with rules |
| 7 | Santa Ana, CA | 80.8 | 297 | May, Dec, Jun | Allowed with rules |
| 8 | Anaheim, CA | 77.6 | 283 | May, Oct, Dec | Allowed with rules |
| 9 | Los Angeles, CA | 77.0 | 281 | May, Nov, Apr | Allowed with rules |
| 10 | San Francisco, CA | 68.5 | 185 | Nov, Jan, Oct | Allowed with rules |
1. San Jose, CA (91.4). 291 fire pit nights a year and only about 2 unhealthy-air days. It sits far enough inland to avoid most Bay wind (just 6 windy evenings a year), and April and May are its best months. Wood fires need a permit here, so gas is the easier route.
2. Oakland, CA (91.2). Almost never too warm (6 evenings a year), and it keeps going when Southern California fades. Oakland still gets about 26 fire pit nights in August, September and October, when Anaheim and Los Angeles drop to 10 to 16 in late summer.
3. Chula Vista, CA (88.3). Tied with San Diego for 311 nights, with no evenings too cold and only 6 too windy. August and September are the soft spots at about 18 to 20 nights.
4. San Diego, CA (84.6). Same weather as Chula Vista next door. It ranks a little lower only because some gas fire pit installs may need a permit, so check with the city before you build one in.
5. Long Beach, CA (82.6). The most fire pit nights in the country, 315 a year. Its score is held back by Los Angeles metro air, which averaged 107 unhealthy-air days a year.
6. Irvine, CA (82.0). 313 nights, and May here (30 nights) is the best single month in the whole study.
7. Santa Ana, CA (80.8). 297 nights a year. August is the weak month, with about 13 nights, as inland heat kicks in.
8. Anaheim, CA (77.6). Inland heat costs Anaheim more than its coastal neighbors: 57 evenings a year are too warm, and August has only about 10 fire pit nights.
9. Los Angeles, CA (77.0). 281 nights a year. November is a top month, and the summer dip is real: about 11 nights in August.
10. San Francisco, CA (68.5). The windiest city in the top 10, with 150 evenings a year over 10 mph. Fall and winter are excellent (24 nights in November, 23 in January), but July has fewer than 5. A tempered-glass wind guard helps here.
Just outside the top 10, Seattle (13th) and Portland (14th) are the best cities outside California, helped by mild summer evenings and some of the cleanest air in the country. Durham, Raleigh, Greensboro, Winston-Salem and Charlotte all finish between 16th and 22nd.
The 10 worst cities for fire pit nights
Scroll the table sideways to see every column.
| Rank | City | Score | Nights/yr | Best months | Gas rule |
|---|---|---|---|---|---|
| 100 | Plano, TX | 26.8 | 92 | Nov, Mar, Dec | No gas-specific rule found |
| 99 | Honolulu, HI | 27.2 | 14 | Feb, Jan, Mar | No gas-specific rule found |
| 98 | Houston, TX | 30.5 | 97 | Dec, Nov, Mar | No gas-specific rule found |
| 97 | Miami, FL | 32.2 | 27 | Jan, Feb, Dec | Allowed with rules |
| 96 | Irving, TX | 32.6 | 91 | Dec, Nov, Mar | No gas-specific rule found |
| 95 | Corpus Christi, TX | 32.6 | 59 | Dec, Jan, Feb | No gas-specific rule found |
| 94 | Fort Worth, TX | 33.2 | 94 | Dec, Nov, Mar | No gas-specific rule found |
| 93 | Frisco, TX | 33.8 | 85 | Mar, Nov, Dec | Allowed with rules |
| 92 | Chicago, IL | 34.0 | 76 | May, Sep, Oct | No gas-specific rule found |
| 91 | McKinney, TX | 34.3 | 87 | Mar, Nov, Dec | Allowed with rules |
100. Plano, TX (26.8). Plano actually gets 92 fire pit nights a year, more than Chicago. It finishes last because the city prohibits backyard wood fires and Dallas-Fort Worth air averaged about 51 unhealthy-air days a year. We found no gas-specific rule, so confirm with the city.
99. Honolulu, HI (27.2). Just 14 nights a year. 154 evenings are too warm and 164 are too windy, thanks to the trade winds. January and February give you 4 or 5 good nights each.
98. Houston, TX (30.5). Winter is better than you might expect: about 19 nights in December and 16 in both November and March. June through August have essentially none, and Houston has the worst air in the bottom 10, about 55 unhealthy-air days a year.
97. Miami, FL (32.2). 27 nights a year, and 209 evenings that are too warm. January is the one real fire pit month, with about 13 nights.
96. Irving, TX (32.6). About 16 nights each in November and December, and none from July through September.
95. Corpus Christi, TX (32.6). The windiest city in the study: 205 evenings a year average more than 10 mph. December and January are the best months at about 14 nights each.
94. Fort Worth, TX (33.2). December is Fort Worth’s month, with 18 fire pit nights, the most of any Dallas-Fort Worth city. Summer evenings are too hot.
93. Frisco, TX (33.8). 109 windy evenings a year on top of the North Texas heat. March and November are the best bets.
92. Chicago, IL (34.0). 76 nights a year, with a short season: May (14 nights) and September (13). Winter has less than one a month, and about 120 evenings a year are too windy.
91. McKinney, TX (34.3). 87 nights a year, peaking in March with about 15. July and August have none.
The best city for fire pit nights in each state
34 states and Washington, DC have at least one of the 100 largest cities. Here is the top-ranked city in each, with its national rank.
Scroll the table sideways to see every column.
| State | Best city | US rank | Nights/yr | Best months | Cities in study |
|---|---|---|---|---|---|
| Alabama | Huntsville | 21 | 129 | Oct, Apr, Mar | 1 |
| Alaska | Anchorage | 28 | 106 | Jul, Jun, May | 1 |
| Arizona | Tucson | 25 | 130 | Dec, Jan, Nov | 7 |
| California | San Jose | 1 | 291 | Apr, May, Nov | 15 |
| Colorado | Colorado Springs | 18 | 128 | Oct, Sep, May | 3 |
| District of Columbia | Washington | 44 | 118 | Oct, May, Apr | 1 |
| Florida | Jacksonville | 24 | 125 | Dec, Jan, Nov | 7 |
| Georgia | Atlanta | 32 | 126 | Mar, Oct, Apr | 1 |
| Hawaii | Honolulu | 99 | 14 | Feb, Jan, Mar | 1 |
| Idaho | Boise | 73 | 88 | Oct, Apr, May | 1 |
| Illinois | Chicago | 92 | 76 | May, Sep, Oct | 1 |
| Indiana | Fort Wayne | 46 | 94 | May, Oct, Sep | 2 |
| Kansas | Wichita | 70 | 79 | Oct, Apr, May | 1 |
| Kentucky | Lexington | 30 | 124 | Oct, Apr, May | 2 |
| Louisiana | New Orleans | 68 | 95 | Dec, Nov, Mar | 1 |
| Maryland | Baltimore | 34 | 115 | Oct, May, Apr | 1 |
| Massachusetts | Boston | 66 | 114 | Oct, May, Sep | 1 |
| Michigan | Detroit | 83 | 79 | Sep, May, Oct | 1 |
| Minnesota | Minneapolis | 58 | 99 | May, Sep, Oct | 2 |
| Missouri | St. Louis | 61 | 100 | Oct, Apr, May | 2 |
| Nebraska | Lincoln | 65 | 80 | Oct, May, Sep | 2 |
| Nevada | Reno | 26 | 123 | Oct, Apr, May | 4 |
| New Jersey | Newark | 36 | 114 | Oct, May, Sep | 2 |
| New Mexico | Albuquerque | 53 | 104 | Oct, Nov, Mar | 1 |
| New York | New York | 54 | 111 | Oct, May, Sep | 2 |
| North Carolina | Durham | 16 | 140 | Oct, Mar, Apr | 5 |
| Ohio | Columbus | 27 | 113 | Oct, May, Apr | 4 |
| Oklahoma | Tulsa | 38 | 100 | Apr, Oct, Nov | 2 |
| Oregon | Portland | 14 | 145 | May, Oct, Sep | 1 |
| Pennsylvania | Philadelphia | 33 | 111 | Oct, May, Apr | 2 |
| Tennessee | Nashville | 31 | 118 | Oct, Apr, May | 2 |
| Texas | Austin | 47 | 97 | Dec, Nov, Jan | 15 |
| Virginia | Chesapeake | 23 | 127 | Oct, Nov, Apr | 3 |
| Washington | Seattle | 13 | 161 | Sep, May, Oct | 1 |
| Wisconsin | Madison | 35 | 103 | Sep, May, Oct | 2 |
A few things stand out. Texas has 15 cities in the ranking, but its best, Austin, is only 47th. Florida’s best is Jacksonville (24th), well ahead of Miami. Outside California, the highest-ranked state winners are Seattle (13th), Portland (14th) and Durham (16th). Illinois and Hawaii have just one city each, Chicago (92nd) and Honolulu (99th), so they come last among the state winners.
Why gas fire pits do better in tough cities
“I love wood-burning fire pits. The crackling and sparking is spectacular, but it’s also highly dangerous,” says Mark Oakley, founder of The Magic of Fire. “You need a steady supply of wood, you have to watch the fire the whole time, you can’t just turn it off when you’re done, and after a few hours around it you stink to high heaven. That’s why I became a gas fire pit convert.”
The cities that score lowest on rules and air quality are where gas fire pits make the most sense.
- They often stay legal on no-burn days. In Maricopa County (Phoenix, Mesa, Chandler, Gilbert, Glendale and Scottsdale), the no-burn ordinance does not apply to fire pits that burn only natural gas or propane (Maricopa County P-26). South Coast AQMD says gas and propane devices are not subject to its No-Burn alerts (South Coast AQMD).
- They work where wood is limited. Denver and Boston restrict backyard fires to gas or approved devices, and Plano and Jersey City prohibit wood fires.
- They make short, cold or breezy evenings worth it. There is no fire to build and nothing to put out. On a 40°F night, or when you only have an hour, that matters.
Full ranking: all 100 cities
Scroll the table sideways to see every column.
| Rank | City | Score | Nights/yr | Best months | Gas rule |
|---|---|---|---|---|---|
| 1 | San Jose, CA | 91.4 | 291 | Apr, May, Nov | Allowed with rules |
| 2 | Oakland, CA | 91.2 | 283 | Apr, Sep, Oct | Allowed with rules |
| 3 | Chula Vista, CA | 88.3 | 311 | May, Jun, Dec | Allowed with rules |
| 4 | San Diego, CA | 84.6 | 311 | May, Jun, Oct | Permit may apply |
| 5 | Long Beach, CA | 82.6 | 315 | May, Jun, Oct | Allowed with rules |
| 6 | Irvine, CA | 82.0 | 313 | May, Jun, Oct | Allowed with rules |
| 7 | Santa Ana, CA | 80.8 | 297 | May, Dec, Jun | Allowed with rules |
| 8 | Anaheim, CA | 77.6 | 283 | May, Oct, Dec | Allowed with rules |
| 9 | Los Angeles, CA | 77.0 | 281 | May, Nov, Apr | Allowed with rules |
| 10 | San Francisco, CA | 68.5 | 185 | Nov, Jan, Oct | Allowed with rules |
| 11 | Riverside, CA | 65.3 | 231 | Dec, May, Mar | Allowed with rules |
| 12 | Stockton, CA | 64.4 | 169 | Nov, Mar, Oct | Allowed with rules |
| 13 | Seattle, WA | 63.2 | 161 | Sep, May, Oct | Allowed with rules |
| 14 | Portland, OR | 59.3 | 145 | May, Oct, Sep | Allowed with rules |
| 15 | Sacramento, CA | 57.5 | 163 | Mar, Apr, Nov | No gas-specific rule found |
| 16 | Durham, NC | 56.2 | 140 | Oct, Mar, Apr | No gas-specific rule found |
| 17 | Raleigh, NC | 55.7 | 138 | Oct, Nov, Mar | No gas-specific rule found |
| 18 | Colorado Springs, CO | 55.2 | 128 | Oct, Sep, May | Allowed with rules |
| 19 | Greensboro, NC | 55.2 | 136 | Oct, Apr, Mar | No gas-specific rule found |
| 20 | Winston-Salem, NC | 54.9 | 137 | Oct, Apr, Mar | No gas-specific rule found |
| 21 | Huntsville, AL | 53.7 | 129 | Oct, Apr, Mar | No gas-specific rule found |
| 22 | Charlotte, NC | 53.5 | 131 | Oct, Mar, Nov | No gas-specific rule found |
| 23 | Chesapeake, VA | 53.1 | 127 | Oct, Nov, Apr | No gas-specific rule found |
| 24 | Jacksonville, FL | 52.4 | 125 | Dec, Jan, Nov | No gas-specific rule found |
| 25 | Tucson, AZ | 52.1 | 130 | Dec, Jan, Nov | No gas-specific rule found |
| 26 | Reno, NV | 52.1 | 123 | Oct, Apr, May | No gas-specific rule found |
| 27 | Columbus, OH | 50.9 | 113 | Oct, May, Apr | Allowed with rules |
| 28 | Anchorage, AK | 50.9 | 106 | Jul, Jun, May | Allowed with rules |
| 29 | Richmond, VA | 50.9 | 128 | Oct, Apr, May | No gas-specific rule found |
| 30 | Lexington, KY | 50.3 | 124 | Oct, Apr, May | No gas-specific rule found |
| 31 | Nashville, TN | 50.1 | 118 | Oct, Apr, May | No gas-specific rule found |
| 32 | Atlanta, GA | 49.8 | 126 | Mar, Oct, Apr | No gas-specific rule found |
| 33 | Philadelphia, PA | 48.0 | 111 | Oct, May, Apr | Allowed with rules |
| 34 | Baltimore, MD | 48.0 | 115 | Oct, May, Apr | No gas-specific rule found |
| 35 | Madison, WI | 48.0 | 103 | Sep, May, Oct | Allowed with rules |
| 36 | Newark, NJ | 47.2 | 114 | Oct, May, Sep | Allowed with rules |
| 37 | Cincinnati, OH | 47.1 | 107 | Oct, May, Apr | Allowed with rules |
| 38 | Tulsa, OK | 46.9 | 100 | Apr, Oct, Nov | Allowed with rules |
| 39 | Memphis, TN | 46.5 | 109 | Apr, Mar, Oct | No gas-specific rule found |
| 40 | Louisville, KY | 46.0 | 110 | Oct, Apr, May | No gas-specific rule found |
| 41 | Tampa, FL | 45.7 | 86 | Jan, Dec, Feb | Allowed with rules |
| 42 | Pittsburgh, PA | 45.7 | 117 | Oct, May, Sep | No gas-specific rule found |
| 43 | Toledo, OH | 45.6 | 91 | Sep, May, Oct | Allowed with rules |
| 44 | Washington, DC | 45.5 | 118 | Oct, May, Apr | No gas-specific rule found |
| 45 | Las Vegas, NV | 45.4 | 125 | Nov, Dec, Feb | No gas-specific rule found |
| 46 | Fort Wayne, IN | 44.7 | 94 | May, Oct, Sep | No gas-specific rule found |
| 47 | Austin, TX | 44.6 | 97 | Dec, Nov, Jan | No gas-specific rule found |
| 48 | Henderson, NV | 44.4 | 131 | Nov, Dec, Mar | No gas-specific rule found |
| 49 | Aurora, CO | 44.3 | 107 | Oct, May, Sep | Allowed with rules |
| 50 | Bakersfield, CA | 44.2 | 150 | Nov, Jan, Mar | Allowed with rules |
| 51 | Virginia Beach, VA | 44.1 | 88 | Oct, Nov, May | No gas-specific rule found |
| 52 | Indianapolis, IN | 44.0 | 99 | Oct, May, Apr | No gas-specific rule found |
| 53 | Albuquerque, NM | 44.0 | 104 | Oct, Nov, Mar | Allowed with rules |
| 54 | New York, NY | 43.8 | 111 | Oct, May, Sep | No gas-specific rule found |
| 55 | Chandler, AZ | 43.8 | 138 | Dec, Jan, Feb | Allowed with rules |
| 56 | Buffalo, NY | 43.4 | 101 | May, Sep, Oct | No gas-specific rule found |
| 57 | Milwaukee, WI | 43.3 | 103 | Sep, Jun, May | No gas-specific rule found |
| 58 | Minneapolis, MN | 43.1 | 99 | May, Sep, Oct | No gas-specific rule found |
| 59 | Orlando, FL | 42.9 | 98 | Dec, Jan, Nov | Permit may apply |
| 60 | Gilbert, AZ | 42.9 | 134 | Dec, Jan, Feb | Allowed with rules |
| 61 | St. Louis, MO | 42.7 | 100 | Oct, Apr, May | No gas-specific rule found |
| 62 | San Antonio, TX | 42.6 | 96 | Dec, Jan, Nov | No gas-specific rule found |
| 63 | North Las Vegas, NV | 42.4 | 125 | Nov, Dec, Feb | No gas-specific rule found |
| 64 | Kansas City, MO | 42.3 | 96 | Oct, May, Apr | No gas-specific rule found |
| 65 | Lincoln, NE | 42.3 | 80 | Oct, May, Sep | No gas-specific rule found |
| 66 | Boston, MA | 42.2 | 114 | Oct, May, Sep | Permit required |
| 67 | Fresno, CA | 42.2 | 153 | Nov, Mar, Apr | Allowed with rules |
| 68 | New Orleans, LA | 42.2 | 95 | Dec, Nov, Mar | No gas-specific rule found |
| 69 | St. Paul, MN | 41.6 | 92 | May, Sep, Oct | No gas-specific rule found |
| 70 | Wichita, KS | 41.4 | 79 | Oct, Apr, May | No gas-specific rule found |
| 71 | Omaha, NE | 41.3 | 84 | Oct, May, Apr | Allowed with rules |
| 72 | St. Petersburg, FL | 41.3 | 78 | Jan, Dec, Feb | No gas-specific rule found |
| 73 | Boise, ID | 41.3 | 88 | Oct, Apr, May | Allowed with rules |
| 74 | Denver, CO | 41.2 | 112 | Oct, May, Sep | Allowed with rules |
| 75 | Oklahoma City, OK | 40.9 | 87 | Apr, Nov, May | No gas-specific rule found |
| 76 | Port St. Lucie, FL | 40.9 | 73 | Jan, Dec, Feb | No gas-specific rule found |
| 77 | Lubbock, TX | 40.2 | 83 | Nov, Dec, Oct | No gas-specific rule found |
| 78 | Cape Coral, FL | 40.0 | 69 | Jan, Dec, Feb | No gas-specific rule found |
| 79 | Phoenix, AZ | 39.4 | 119 | Dec, Jan, Feb | Allowed with rules |
| 80 | Mesa, AZ | 38.8 | 116 | Jan, Dec, Feb | Allowed with rules |
| 81 | El Paso, TX | 38.5 | 114 | Nov, Dec, Feb | No gas-specific rule found |
| 82 | Laredo, TX | 38.2 | 70 | Jan, Dec, Nov | No gas-specific rule found |
| 83 | Detroit, MI | 38.1 | 79 | Sep, May, Oct | No gas-specific rule found |
| 84 | Jersey City, NJ | 37.8 | 111 | Oct, May, Sep | No gas-specific rule found |
| 85 | Scottsdale, AZ | 36.7 | 117 | Dec, Jan, Feb | Allowed with rules |
| 86 | Cleveland, OH | 36.5 | 79 | May, Sep, Oct | Permit may apply |
| 87 | Arlington, TX | 35.9 | 94 | Nov, Dec, Mar | Allowed with rules |
| 88 | Glendale, AZ | 35.6 | 115 | Jan, Dec, Feb | Allowed with rules |
| 89 | Dallas, TX | 35.1 | 90 | Dec, Mar, Nov | Allowed with rules |
| 90 | Garland, TX | 34.6 | 88 | Nov, Mar, Dec | Allowed with rules |
| 91 | McKinney, TX | 34.3 | 87 | Mar, Nov, Dec | Allowed with rules |
| 92 | Chicago, IL | 34.0 | 76 | May, Sep, Oct | No gas-specific rule found |
| 93 | Frisco, TX | 33.8 | 85 | Mar, Nov, Dec | Allowed with rules |
| 94 | Fort Worth, TX | 33.2 | 94 | Dec, Nov, Mar | No gas-specific rule found |
| 95 | Corpus Christi, TX | 32.6 | 59 | Dec, Jan, Feb | No gas-specific rule found |
| 96 | Irving, TX | 32.6 | 91 | Dec, Nov, Mar | No gas-specific rule found |
| 97 | Miami, FL | 32.2 | 27 | Jan, Feb, Dec | Allowed with rules |
| 98 | Houston, TX | 30.5 | 97 | Dec, Nov, Mar | No gas-specific rule found |
| 99 | Honolulu, HI | 27.2 | 14 | Feb, Jan, Mar | No gas-specific rule found |
| 100 | Plano, TX | 26.8 | 92 | Nov, Mar, Dec | No gas-specific rule found |
The CSV download also lists each city’s biggest limit (heat, cold, rain or wind), unhealthy-air days and monthly counts.
Frequently asked questions
What is the best month for a fire pit?
October, for most of the country. It averages about 16 fire pit nights per city and is the best month in 34 of the 100 cities. The answer changes by region: in Texas and Florida the best months are December through March, and in Chicago they are May and September. Every city’s best months are in the full ranking below.
What temperature is too cold for a fire pit?
We used 45°F as the cutoff, measured as the average from 7 pm to 10 pm. Plenty of people sit out below that, especially with a gas fire pit that lights in seconds. Dry, calm evenings between 35°F and 45°F add 60 to 70 extra nights a year in Reno, Seattle and Portland.
How windy is too windy for a fire pit?
We counted evenings with average wind over 10 mph as too windy. Wind blows smoke and flame around, and it is the main reason Corpus Christi, Honolulu, Chicago and San Francisco lose so many nights. On a gas fire pit, a tempered-glass wind guard keeps the flame steady on breezy evenings.
Which US city has the most fire pit nights?
Long Beach, California, with about 315 a year, followed by Irvine (313), Chula Vista and San Diego (311 each). San Jose has the highest overall score because it also has very clean air.
Which US city has the fewest fire pit nights?
Honolulu, with about 14 a year, then Miami (27). Both are rarely cold, but most evenings are too warm, and Honolulu’s trade winds rule out many of the rest.
Can I use a gas fire pit during a burn ban?
Often, but not everywhere. Maricopa County’s no-burn rule does not apply to fire pits fueled only by natural gas or propane (Maricopa County P-26), and South Coast AQMD No-Burn alerts do not apply to gas or propane devices (South Coast AQMD). Some cities, such as Madison, Wisconsin, include gas fire pits in burn bans (City Rule Lookup). Check your city or county before lighting up on a no-burn day.
Do I need a permit for a gas fire pit?
Usually not for a portable, listed gas fire pit. Of the 100 cities we checked, only Boston clearly requires one, and San Diego, Cleveland and Orlando may for some installations. More than half the cities have no gas-specific rule at all, so call your fire department if you are unsure. Running a new natural gas line is a different matter and normally needs a licensed installer and a gas or plumbing permit.
Find a gas fire pit for your city’s best nights
If your city made the top 10, you have fire pit weather most of the year. If it landed near the bottom, a gas fire pit is the way to make the most of the nights you do get, including the crisp ones and the no-burn days.
“With gas you get control, a clean burn and no smell, and you turn it on and off whenever you like,” Oakley says. “The risk is enormously reduced compared with wood. When you sum it all up, it’s a no-brainer.”
- Browse our gas fire pit collection: fire bowls, fire tables and fire pits for patios and decks.
- Building your own? Our gas fire pit kits come with the burner, pan and ignition.
- In a windy city like Corpus Christi, Chicago or San Francisco, add a wind guard.
- Still choosing a fuel? Read natural gas vs. propane: which should you choose and how close a fire pit can be to a house.
Use this map on your site
You are welcome to share the map and data with a link back to this page. Copy this code to embed the map:
Methodology
- Cities: the 100 most populous US cities, from the Census Bureau’s July 2025 estimates (Wikipedia list of US cities by population).
- Weather (70% of the score): hourly temperature, precipitation and 10-meter wind speed for 7 pm, 8 pm and 9 pm local time at each city center, January 1, 2021 to December 31, 2025, from the Open-Meteo historical weather API. A night counts if the three-hour average temperature is 45°F to 70°F, total rain is under 0.01 inch, and average wind is 10 mph or less. Scores are scaled from 0 (fewest nights) to 100 (most). Reanalysis data is modeled on a grid, so it can differ slightly from a single airport weather station.
- Air quality (15%): average yearly days with AQI over 100 (unhealthy for sensitive groups or worse) in each city’s metro area, 2023 to 2025, from the EPA AirData annual AQI files. 0 such days scores 100, and 60 or more days scores 0. Most of these days come from daytime ozone or wildfire smoke, so this measures overall air quality, not evening air only. Cities in the same metro area share the same figure.
- Rules (15%): from our city-by-city rules research, weighted 60% gas and 40% wood. Gas: allowed with rules = 100, no gas-specific rule found = 70, permit may apply = 60, permit required = 40. Wood: allowed with rules = 100, permit required = 60, unclear = 50, gas or approved devices only = 30, prohibited = 0.
- Robustness check: loosening the definition to 45°F to 75°F and wind up to 12 mph leaves the top 10 unchanged. The bottom stays dominated by Gulf Coast, Florida, Texas and Great Lakes cities.
- Crisp nights: dry evenings averaging 35°F to 45°F with wind of 10 mph or less. These are reported separately and are not part of the score.
Full dataset with monthly counts for every city: download the CSV.
You are welcome to use this data and chart with a link back to this page. Source: The Magic of Fire analysis of Open-Meteo, EPA AirData and city fire codes.